

Who's Buying the Housing That's Left
Investors bought one in three single-family homes sold in 2025. 87 percent of them are small investors — not institutions. I almost became one. This is what the math looks like when you follow it all the way.
After the last post, I went back to Zillow to gut-check the argument.
I ran the qualifying tool on the scenario we've been talking about — a household solidly in the middle: above the income threshold for assistance, below what new construction actually requires. A $250,000 qualifying price. Monthly payment around $1,700 to $1,800 on a 30-year fixed. I'm in that range, and so is a lot of the country. For a few minutes the math looked closer than I expected.
Then I applied the filter that doesn't show up in any affordability index.
School district.
The homes available at $250,000 — more of them than I expected — weren't in the districts worth moving a family into. The homes in the right districts were $350,000 to $400,000, minimum. And when I looked at what those homes rent for — same rooms, same location, same school catchment — the number was $2,000 to $3,000 a month.
The indexes measure income against median price. They don't measure what it costs to rent the home you can't afford to buy, in the location you actually need. I'm not being asked to pay less to rent than to own. I'm being asked to pay a premium for the privilege of not owning — in the zip code that actually works.
The Correction I've Been Waiting For
I've been through this three times. 1988. The dot-com bust. 2008. Each time the market reset and people like me could get back in. I benefitted from 2008 directly — sold my raised ranch at $135,000, bought a two-story at $185,000. The correction gave me the rung.
My optimism that it happens again isn't wishful thinking. It's pattern recognition from lived experience.
But every previous correction had the same mechanism: forced selling. Overleveraged homeowners. Foreclosures flooding the market. Banks liquidating distressed assets. Prices reset because people who had to sell were selling.
The entity that bought those foreclosed homes in 2009 and 2010 — Blackstone, Invitation Homes, American Homes 4 Rent — doesn't have to sell. Long-term debt structures. No paycheck needed next month. No margin call. Those homes were converted from for-sale inventory to permanent rentals. They haven't come back and they won't. The mechanism that drove every correction I've experienced doesn't apply to the holders who accumulated since.
The correction I've been waiting for may not come. Not because the market is healthy. Because the forced-selling trigger has been removed.
Who's Actually Buying
In 2025, investors bought 33 percent of single-family homes sold in the United States. One in three. A five-year high.
When you read about institutional investors and housing, the number usually cited is the nationwide ownership share — large institutional buyers own less than two percent of the 86 million single-family homes in this country. That number is accurate. It's also misleading about where the concentration actually lands.
Because 87 percent of investor-held single-family homes are owned by small investors holding between one and five properties.
I was scrolling through listings and noticed that half the available homes were sitting empty. Not because original homeowners moved out. Flippers. Remodelers. People who bought the worst house in a decent neighborhood, put money into it, and listed it back at a higher floor. The entry point that used to exist for first-time buyers into good neighborhoods is now primarily an investor play. The rung got monetized before you got there.
I Caught Myself
My plan, working through all of this, was to buy something and hold it as a rental. The math made sense — rent it out, cover the mortgage, build equity while I wait for the market to let me move up. I even looked at Arrived, a platform that lets you buy fractional shares in single-family rental properties. I understand the logic because I was running the same logic.
Then I caught myself.
Not because the decision is wrong exactly. Because I would be joining the 87 percent. Every individual decision is rational. Every person running that calculation is responding correctly to the incentives in front of them. The aggregate of those rational decisions is the system that moves the floor.
I almost contributed to it. I still might. The math still makes sense for me personally. That's exactly the point.
The ROAD Act and What It Tells You
The 21st Century ROAD to Housing Act passed the Senate in March 2026. The argument: restrict institutional investor purchases of single-family homes, redirect capital toward for-sale construction. Senator Moreno named it plainly on the Senate floor: "Every home built for rent in Ohio is one less home available for purchase, fueling fiercer competition and driving up prices even higher for everyone else."
The argument is correct.
NAHB — the National Association of Home Builders — flipped. They were prepared to support the bill, then reversed when the seven-year sell-off provision stayed in. That clause would require build-to-rent investors to eventually put homes back on the for-sale market. NAHB's stated objection: it would reduce investment in single-family rental housing and cut production by roughly 40,000 units per year.
Their exact words: "Blaming investors for the high cost of housing is a distraction."
The homebuilders' lobby is defending the system that keeps homes from being built for sale. NAHB members build build-to-rent communities. The seven-year rule threatens that revenue stream. Their concern about housing supply is real — it's supply of rental units, not for-sale homes. When the choice had to be made, that's where they landed.
The bill is in House-Senate conference now. Even a clean passage redirects future capital. It doesn't recover the 17 million investor-held homes already converted to rentals. It doesn't bring back inventory that permanently left the for-sale market over the last 15 years. And it doesn't touch the 87 percent — the aggregate of individual rational decisions, including the one I've been sitting with.
The rental property plan is probably wishful thinking.
The same appreciation that would make a $250,000 home a good investment is the same floor rising that prices me out of the next step. The equity builds on paper. The tax assessment rises. The insurance rises. And somewhere in that plan is the assumption I haven't examined hard enough — that the income holds, the timing works, the next rung stays close enough to reach.
That assumption is exactly what the structural argument in the last post said out loud: the aspiration is the same one it's always been. The floor beneath it has moved.
I might just need to be happy with what I have.
That isn't defeat. That's what the math leads to when you follow it all the way. The ROAD Act targets the 2 percent that's visible. The 87 percent — the aggregate of individual decisions, mine included — continues unaffected. The distraction the homebuilders named is the distraction the system runs on. Every person inside it learns the same lesson eventually: the rational move for you is the move that makes it harder for the next person.
At some point the most honest thing is to stop reaching for the rung that just moved.
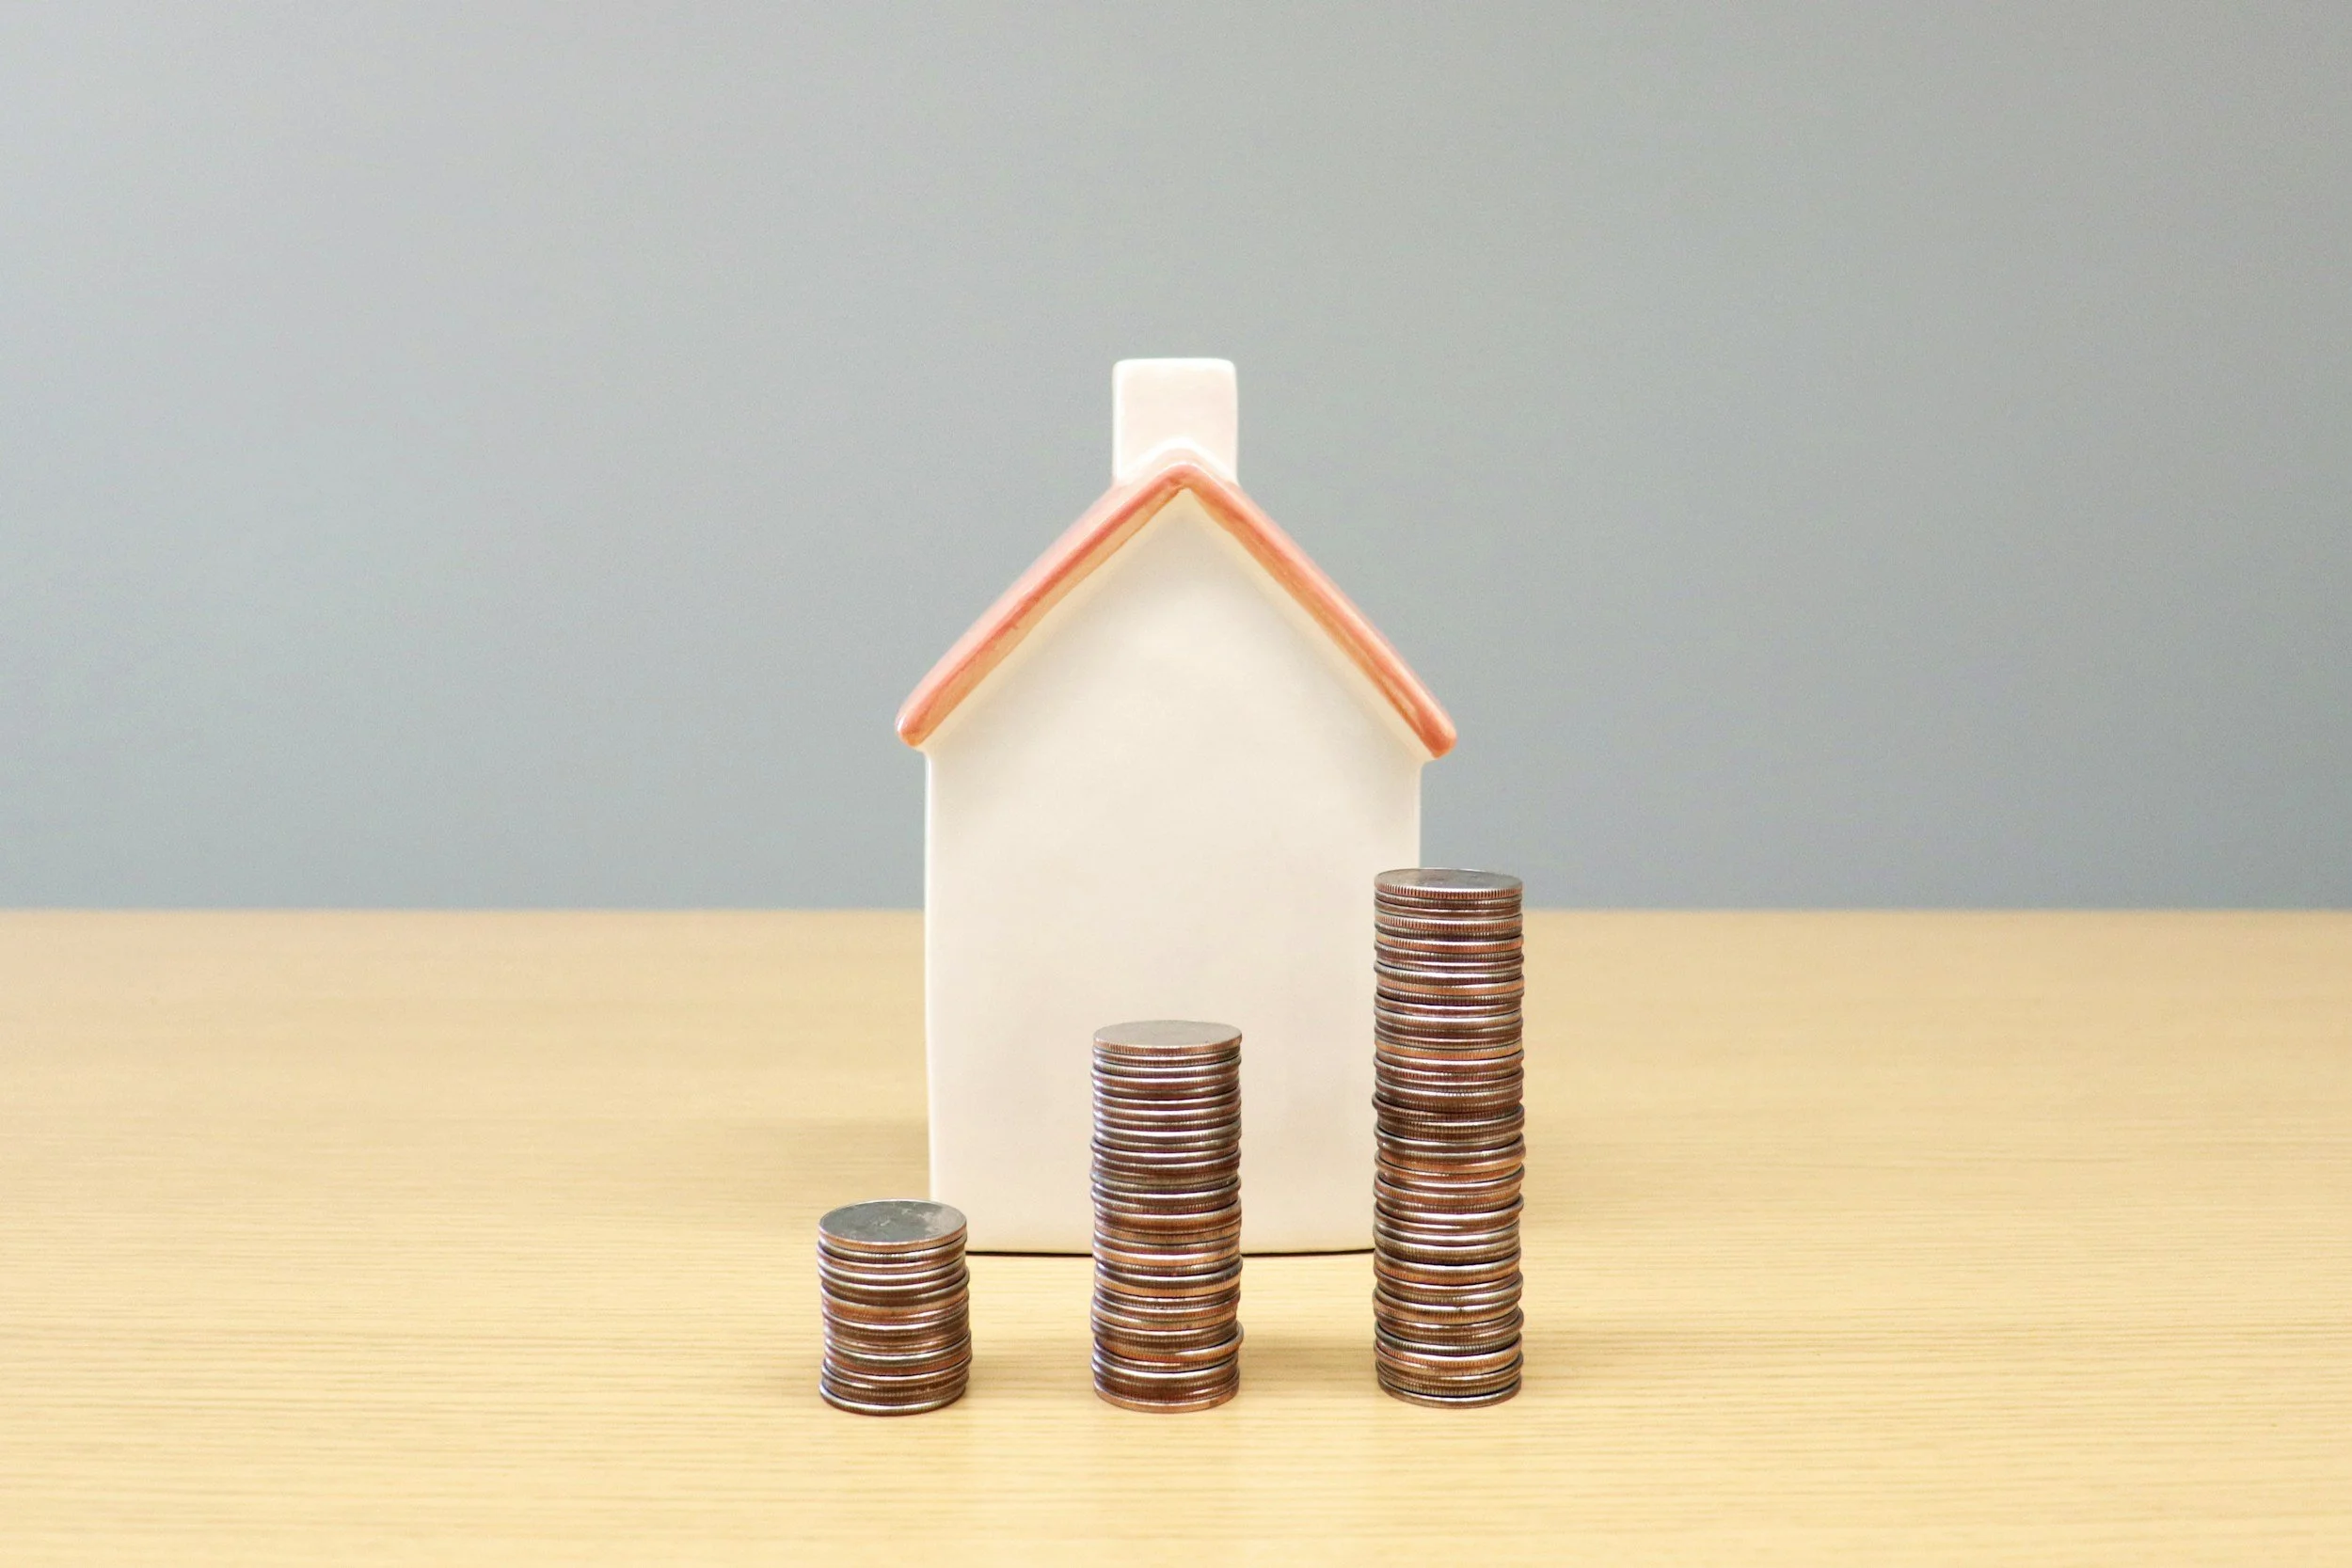
The Housing Affordability Gap
The median first-time buyer is now 38 years old. The monthly payment on the median home has more than doubled since 2019 while incomes grew 20%. This is a structural problem — and this is what it looks like from the inside.
I design homes for a living. Thirty years of it. I know what a $250,000 home costs to build, what it takes to finance, and what it should deliver for a family.
I'm renting a two-bedroom apartment for $1,500 a month.
Not because I haven't tried. Not because I'm waiting for something better. The home I can qualify for — the price point where a mortgage payment becomes an honest trade for what I'm paying in rent — is around $250,000. That home is essentially not on the market. When it appears, it disappears. What's available is priced well above what I can qualify for, and the gap between those two numbers is not closing.
If this is true for someone who works in this industry — who reads construction bids and floor plans the way other people read menus — what does it mean for everyone standing below that line?
The Number That Tells the Whole Story
68% of American households cannot afford the median new construction home. That's not a rounding error. That's two out of three households priced out entirely.
The broader market isn't much better. As of Q1 2025, only 42% of homes sold — new and existing — are affordable to a median-income family by the standard definition: 28% of gross income, 10% down, prevailing 30-year rate.
The majority of homes sold in this country are out of reach for the median household.
Here's the math that explains how we got here:
In 2019, the median home sold for $321,500. At 3.7%, the monthly payment was about $1,186.
That same home in January 2026 costs $400,500. At 6.38%, the payment is $2,499.
The price went up 25%. The payment went up 111%. Median household income over the same period grew 20%.
That gap — between what payments cost and what incomes earned — is where the affordability crisis actually lives. It's not a housing price problem alone. It's a rate problem layered on a price problem layered on a wage problem. Three forces moving in the same direction at the same time.
Who Gets Squeezed First
The first-time buyer share of the market hit a new historic low in 2024: 24%. The median age of a first-time buyer is now 38. Historically it was 29.
That's not a market entry problem. That's nearly a decade of waiting while the floor rose.
The households being squeezed hardest aren't the ones subsidized housing was designed for. They're the ones above it — earning 80 to 120% of area median income. Solidly middle class by any reasonable measure. Above the threshold that qualifies for assistance. Below what the current market requires.
A household earning $90,000 a year cannot afford the median new construction home at current rates. Not by standard underwriting. Not without a down payment that takes years to accumulate on top of current rent.
That gap — where subsidized housing ends and the real market begins — is where millions of households are currently standing. Earning too much to qualify for help. Not earning enough to qualify for the market. Forgotten in between.
The Trap Inside the Trap
There's a decision point this market creates that almost nobody says plainly.
Two incomes used to be an advantage. Now, for a household with young children, a second income can be a break-even. The job that covers daycare doesn't get you closer to the house. You're working to maintain the position you're already in.
A stay-at-home parent in 2026 isn't always a lifestyle choice. For many households, it's a math conclusion: the second income nets nothing after childcare. But losing it doesn't close the homeownership gap either. The house stays out of reach regardless.
Health insurance belongs in this conversation too, because it's a cost that almost never makes it into the housing affordability discussion — it isn't a housing expense, so it doesn't show up in any index. But it competes for the same budget. A generation ago, employer-sponsored coverage was a given for most working households. For anyone self-employed, or for a household where one spouse has stepped out of the workforce, that coverage has to be replaced on the open market. A family plan runs $800 to $1,500 a month or more depending on age and deductible. That money isn't going toward a down payment. It's keeping the family covered. And it's a line item the generation before us largely never had to factor into the homeownership math.
The aspiration — raise your kids, own your home, build something stable — is the same one it's always been. The floor beneath it has risen past where a single income can reach it, and the second income doesn't reliably change that.
What's Not Being Said About Who This Really Hurts
Home equity represents 60 to 70% of middle-class net worth. Not stock portfolios. Not retirement accounts. Home equity.
The median net worth of a homeowner is approximately $430,000. The median net worth of a renter is approximately $10,000. A 43-to-1 ratio.
This is not a shelter gap. This is a wealth-building crisis.
Every year a household spends renting — doing everything right, paying on time, saving what they can — is a year of equity they don't accumulate. A year of price appreciation someone else captures. A year of net worth that doesn't grow. And the longer this continues, the harder the gap becomes to close, because the homes they could eventually afford are being purchased by people who already own and are rolling equity forward.
The lock-in compounds it from the other direction. Homeowners who refinanced at 2.75% in 2021 aren't selling. Why would they? Moving means giving up a 3% mortgage and taking on a 6.5% one. The inventory that would move doesn't move. The first-time buyer has nowhere to enter.
The racial homeownership gap is where this gets most honest: White 73.6%, Black 44.2% — a 29-point spread that hasn't closed. That is not a market outcome. It is a policy legacy. Redlining, restrictive covenants, minimum square footage zoning written to price out specific populations. The gap that exists today is the compounded result of decisions made before most people reading this were born. Richard Rothstein's The Color of Law documents exactly how it was built. The market didn't create it. Policy did. And policy has not undone it.
The System Is Working As Designed
Regulatory costs embed 23.8% of the final price of a new single-family home before construction begins. On a $400,000 home, that's roughly $95,000 in permitting, compliance, fees, and zoning — baked in. Fixed infrastructure costs for a lot are roughly the same whether a developer builds a $600,000 home or a $300,000 one. But the margin on the larger home is four to five times higher in absolute dollars.
Builders aren't villains. They respond rationally to the incentives in front of them. Those incentives don't reward building the home that most households can afford. They reward building larger. That's the argument I made in an earlier post about square footage — that size and value aren't the same thing, and the market has spent decades confusing the two.
There are policy levers being pulled. Zoning reform in Oregon and Montana. California's ADU expansion that grew from roughly 5,000 permits per year in 2016 to over 24,000 by 2022. The proposed ROAD Act restricting institutional single-family purchasing. These are real efforts. They may slow the bleeding.
None of them reverse what's already built in. The system wasn't broken by accident. It accumulated — policy decisions, regulatory structures, developer incentives, exclusionary zoning — over decades. Legislative adjustment can redirect incentives. It cannot undo the decades of inventory and wealth already locked out of reach.
The Honest Conclusion
The housing affordability crisis is not a market failure.
Markets are doing exactly what they were built to do. The problem is what they were optimized for — and who they were never designed to serve.
The crack underneath this isn't fixed with a bill, a rate cut, or a new administration. What it requires is something the political system has never been particularly good at: restructuring with empathy at its center. Not ideology. Not a party platform. Empathy — for the household that earns $90,000 and still can't get in the door. For the family doing the math on whether a second job is worth it. For the first-time buyer who has been waiting since they were 29 and is now 38 and still waiting.
The ROAD Act may redirect some capital. Rate normalization may ease the monthly payment math. Zoning reform may open some inventory over time.
But the crack is structural. And nothing currently on the table closes it.
That's not pessimism. That's clarity. And clarity is where an honest conversation about housing in America actually has to start.
If You Want to Go Deeper
Three sources worth your time.
Richard Rothstein — The Color of Law: A Forgotten History of How Our Government Segregated America (2017) The most important book on why the racial homeownership gap exists and why it isn't closing. Rothstein documents, with primary sources, how federal, state, and local government — not private prejudice — built segregation into the geography of American housing through FHA redlining, racially restrictive covenants, and exclusionary zoning. If the 29-point gap between White and Black homeownership rates made you stop reading, this is where that number comes from. Available anywhere books are sold.
Harvard Joint Center for Housing Studies — The State of the Nation's Housing (annual) The most comprehensive annual survey of housing conditions in America. Where the cost-burden numbers live — 22.7 million renter households spending more than 30% of income on housing, 12.1 million spending more than half. Updated every year. Free at jchs.harvard.edu.
U.S. Census Bureau — Housing Vacancies and Homeownership Survey (HVS) The government's own quarterly count of who owns and who rents in America, broken down by race, region, and income. The homeownership rate data in this post comes directly from it. Dry reading but the numbers don't lie. Free at census.gov/housing/hvs.
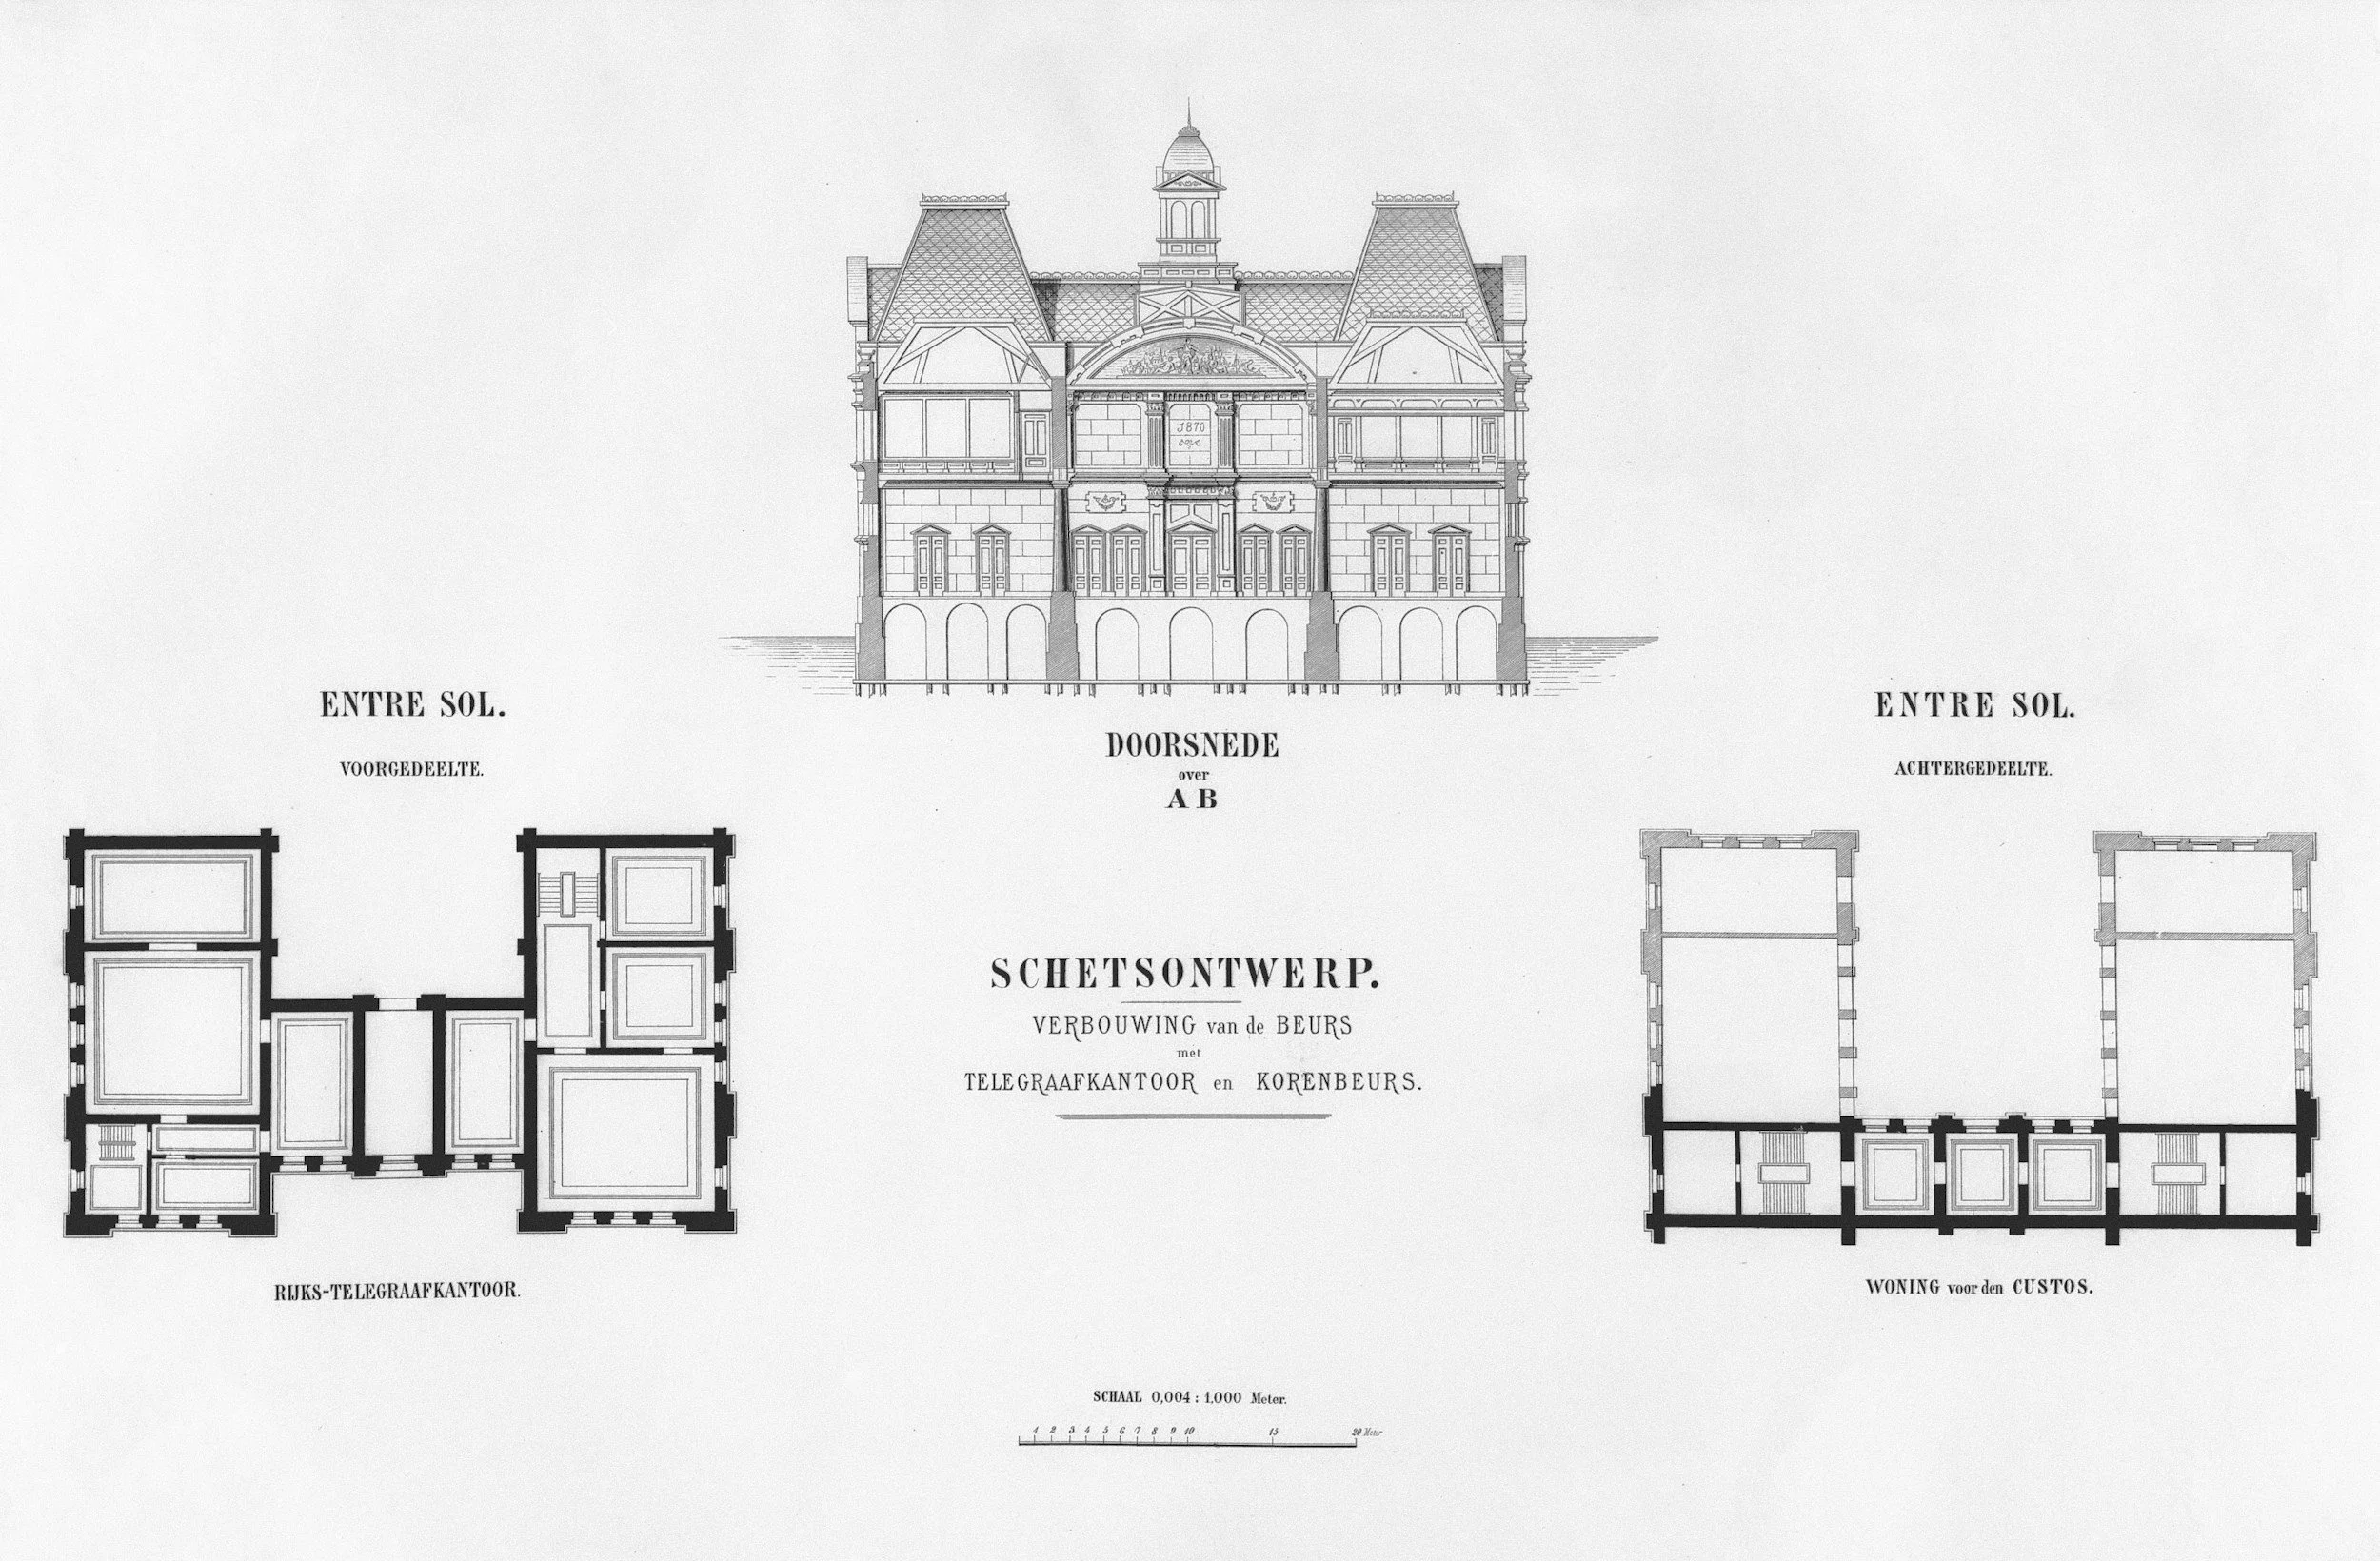
What a Builder Actually Looks for in a Set of Plans
Homeowners evaluate a floor plan like a photo. Builders read it looking for something different: whether it's complete, whether it's coordinated, and whether it will hold up when a framing crew shows up and needs to know where to start.
Homeowners evaluate a floor plan the way they'd evaluate a photo. Does the layout make sense? Are the rooms the right size? Does the kitchen connect to the backyard the way they want?
Those are reasonable questions. They're just not the questions a builder asks.
A builder reads a plan set looking for something different: whether it's complete, whether it's coordinated, and whether it will hold up when a framing crew shows up at 7 a.m. and needs to know exactly where to start. The answer to those questions determines whether a project runs clean or generates problems from the first day of construction.
What "Complete" Actually Means
A residential plan set has components: floor plans, foundation plan, roof plan, building sections, wall sections, exterior elevations, interior elevations for complex conditions, door and window schedules, structural notes, and details for anything that isn't self-evident from the floor plan.
Every one of those components answers a different set of questions. The floor plan tells you where rooms are. The section tells you how the building goes together vertically — ceiling heights, floor-to-floor dimensions, how the roof meets the wall. The details tell a framer or a finish carpenter exactly what a condition is supposed to look like in three dimensions.
When a component is missing, the builder has to make a decision. Sometimes that decision is correct. Often it isn't — not because the builder is careless, but because they're working from incomplete information. An assumption that turns out to be wrong in framing has to be corrected in drywall. A rough-in that goes in the wrong location has to be moved after the walls are closed.
Every one of those corrections costs money. None of them show up in the original bid.
The Coordination Problem
The most expensive failures in residential construction don't come from bad design. They come from design that doesn't talk to itself.
A residential home has three overlapping systems: the architecture (walls, floors, roofs, openings), the structure (beams, headers, posts, bearing conditions), and the mechanical (HVAC ducts, plumbing chases, electrical panels and runs). On a well-coordinated set of plans, these three systems have been reconciled. The structural beam that carries the load above the open kitchen is sized and located on the plans. The HVAC trunk line has a chase to run through. The plumbing stack doesn't land in the middle of a structural post.
On a poorly coordinated set, those conflicts exist on paper — and they get discovered on site.
A framer finds a beam location that conflicts with the duct layout. A plumber rough-ins a vent stack through a bearing wall. An electrician needs a panel location that wasn't accounted for in the floor plan. Each of these is a call to the designer, a delay while it gets resolved, and a change order once the solution is found. Multiply that by a half-dozen coordination failures on a single project and you've added weeks to the schedule and thousands of dollars to the cost.
The coordination work happens in the drawing set — or it happens on the job site at construction rates.
What Builders Look for When They First Open a Plan Set
Before a builder prices anything, they're scanning the drawings for answers to a short list of questions:
Is the foundation clear? Type, depth, bearing conditions. If it's a walkout or a daylight basement, are the grade conditions shown? Is the structural loading from above accounted for?
Are the ceiling heights called out? This affects framing, mechanical rough-in, door heights, and stair calculations. A plan that doesn't call out ceiling heights requires a phone call before framing starts.
Where do the beams go? Open floor plans require beam work. Flush beams, drop beams, ridge beam or ridge board — these structural decisions affect how the house gets framed and what the finish condition looks like. An experienced builder will figure it out. An inexperienced one will make a guess. Neither outcome should depend on what's not in the drawings.
Is there a window and door schedule? Not just openings on the floor plan — a schedule that lists unit sizes, rough opening dimensions, operation type, glazing specs, and hardware. Without this, a framer is sizing rough openings from the plan and hoping the unit the homeowner selects later fits.
What are the finish levels? This is where the Specification Outline earns its place. The drawings show what gets built. The spec tells a builder what standard they're building to — which determines their material and labor cost for every finish trade.
Why Plan Quality Is Invisible Until It Isn't
A homeowner buying a stock plan has no way to evaluate most of this. The floor plan looks right. The elevations look nice. The bedroom count is correct. None of that tells them whether the structural coordination is resolved, whether the section drawings are complete, or whether there's enough detail in the drawing set for a contractor to build from without calling the designer every week.
Plan quality is invisible right up until it isn't — and when it surfaces, it surfaces as a change order, a schedule delay, or a condition on site that nobody priced because nobody showed it in the drawings.
This is the gap between a plan drawn by a designer and a plan drawn by someone who has been on a job site when the plans didn't hold up. The former knows what looks correct on paper. The latter knows what a framing crew needs at 7 a.m.
Those two things are not always the same.
What This Means When You're Buying a Plan
You're not going to review the structural sections of a stock plan before you buy it. That's not a reasonable expectation.
What you can do is understand who drew it and what experience is behind it. Has the designer managed construction? Have they sat in a meeting where a contractor is pointing at a drawing and asking a question that shouldn't need to be asked? Do they understand what a plan set is actually for — not just as a design document, but as a construction document?
A plan drawn by someone with that background is a different tool than one drawn without it. It coordinates. It answers questions before they get asked. It doesn't generate change orders from its own omissions.
That's the plan a builder wants to work from. It's also the plan a homeowner wants to buy.
Every RED Residential Design plan is drawn from experience on both sides of this — design and construction. The Specification Outline that comes with every plan answers the questions the drawings can't: what standard you're building to, what the contractor is pricing, and what you have the right to expect when they build it.

Kill Your Ego of Square Footage
Square footage is a status number — not a design number. Every square foot you add costs money to build and money to maintain, and that money comes from somewhere. Usually your finishes.
I've been designing homes for thirty years. Not one of them have I been able to afford.
The harder pill to swallow: not one of my clients has ever asked me about that. In thirty years of conversations about dream homes, budgets, finishes, and floor plans — nobody thought to ask the designer whether he could build what he was drawing. Over the last six years, the gap between what I design and what I can afford has doubled.
I'm not telling you that for sympathy. I'm telling you because it shaped a philosophy I bring to every project, and I think it's worth saying out loud.
The Number That's Costing You
Square footage is the first number everyone fixates on. It shows up in listings, in conversations with builders, in the way people describe their dream home at a dinner party. "We're thinking 2,800 square feet." It's a status number as much as a functional one.
Here's what that number doesn't tell you: what you're giving up to get it.
Every square foot you add to a home costs money to build and money to maintain — and that money has to come from somewhere. Most of the time, it comes from your finishes. The countertops get value-engineered. The windows drop a tier. The trim package gets simplified. The flooring that made you fall in love with the model home quietly disappears from your contract. You end up with a large home that feels like a compromise from the day you move in.
That's house poor. And it's one of the most common outcomes in new construction.
Live in Rooms That Fit Your Life
The alternative isn't a small house. It's a right-sized house — one where every room earns its square footage because it was designed around how you actually live, not how much space you think you should have.
When I start a design, I build a program first. A list of rooms, yes — but more than that. A description of how each space needs to feel and function. The mudroom that has to handle four kids and a dog. The kitchen that needs to connect to the backyard because that's where summers happen. The primary bedroom that's a retreat, not just a place to sleep. Those descriptions shape a home that fits a life. Square footage is the result of that process, not the starting point.
When I price that program against a client's budget and the numbers don't align, we adjust the list — before anything gets drawn, before anyone gets attached. It's a much easier conversation to have over a room list than over a floor plan you've already fallen in love with.
What the Budget Freed Up Actually Buys
Spend less on floor space and your budget goes somewhere better: the finishes you'll touch and see every single day. Hardwood instead of LVP. Quartz instead of laminate. A tile shower that doesn't look like a builder special. Windows that actually perform in a Nebraska winter. A kitchen that functions the way a kitchen should.
Those are the things that make a home feel like yours ten years after you move in. Square footage just makes it feel big on the day of the open house. It's not just a philosophy — more than half of buyers say they'd trade square footage for better products and finishes if given the choice.
The Philosophy in Practice
I realize there's an irony in a residential designer arguing against square footage. But the piece I can control is helping clients make smarter decisions about where their money goes — and the smartest decision most of them can make is to build less house and finish it better.
That philosophy is baked into every plan at RED Residential Design. The layouts are efficient by intent. The room relationships are thought through. Nothing is sized to impress on a spec sheet. Everything is sized to work for the people living in it.
Your budget is finite. Spend it on quality, not square footage.
*If you're ready to stop sizing for the spec sheet and start designing for your life — that's exactly what RED plans are built to do. Specification Outline included with every plan. Construction Cost Estimate available at checkout.*